
TL;DR: On the new Dashboard, your total value lives in the Portfolio Value widget, which you can view as Total, Crypto, or Fiat and over ranges from 1 week to All. Each range shows the change as an amount and a percentage. Per-asset 24h, 7d, and 30d trends appear in the Holdings table, and the biggest 24-hour movers appear in Top Movers. What the totals show also depends on your Balance source (Reported or Calculated).
Where is the total value shown?
The Portfolio Value widget shows your total portfolio value as a large figure, with the change for the selected period underneath it as both an amount and a percentage. You can:
- Switch the view between Total, Crypto, and Fiat.
- Change the time range: 1W, 1M, 3M, 1Y, or MAX.

How are the 24h trends shown?
Per-asset price trends appear in the Holdings table, which has separate 24h, 7d, and 30d columns. Positive changes are shown in green and negative changes in red, so you can see at a glance how each coin has moved.
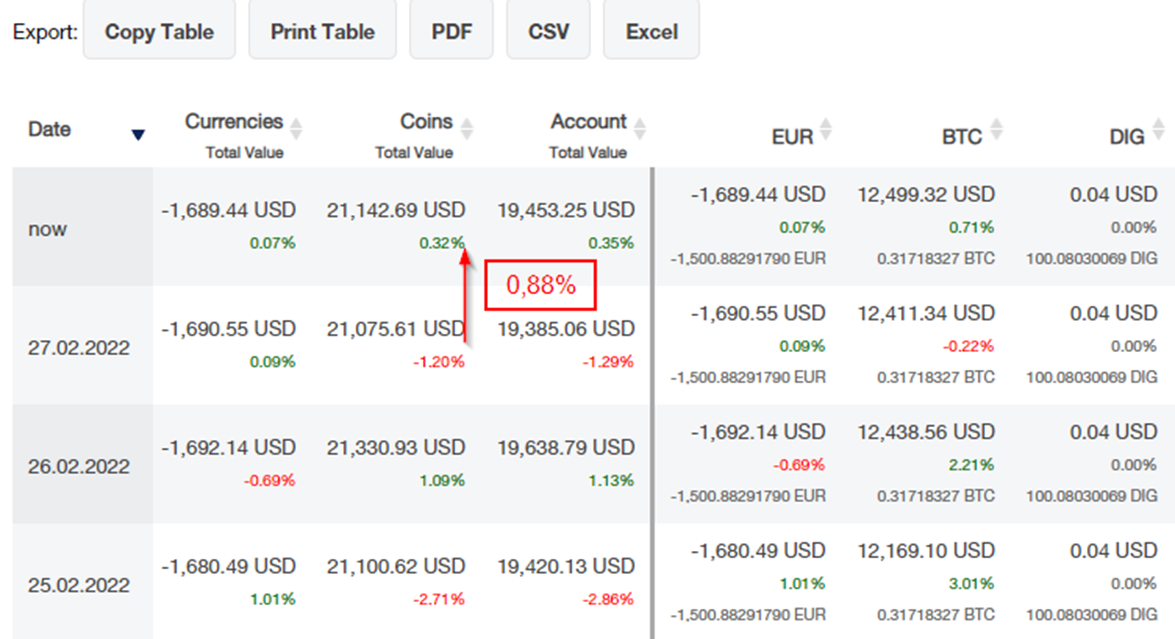
What are the Gainers and Losers?
The Top Movers widget highlights the biggest 24-hour Gainers and Losers in your portfolio, each with its current value and percentage change. It is a quick way to spot what moved the most today.
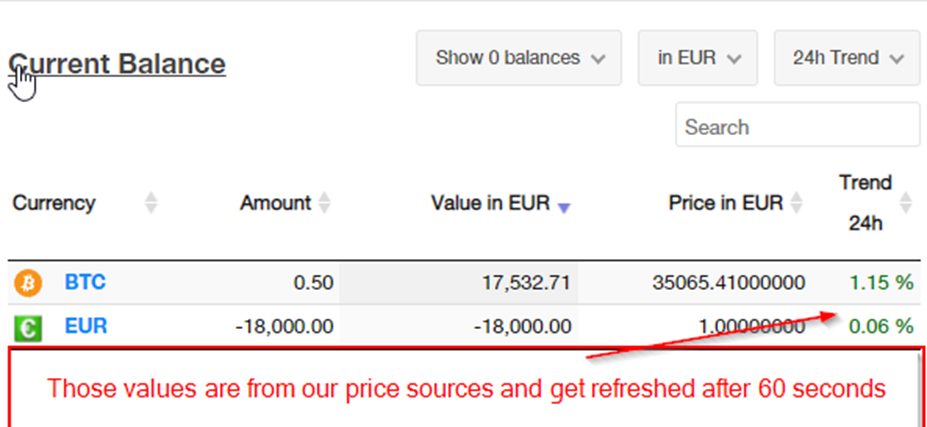
Why does the total sometimes differ from other reports?
The new Dashboard lets you choose a Balance source using the icon in the top-right corner:
- Calculated uses balances derived from your imported transactions. This matches the old Dashboard and lines up with detailed reports like Daily Balance and Balance by Exchange.
- Reported uses the latest balances synced from your connected exchanges and wallets, which can differ from your imported history.
If your total looks different from a detailed report, check which source is selected. For more detail, see What's new on your Dashboard.
Summary
The Dashboard gives you a near real-time snapshot of your portfolio: the Portfolio Value widget for your total and its trend, the Holdings table for per-asset 24h, 7d, and 30d changes, and Top Movers for the day's biggest moves. For exact historical values, open the Daily Balance or Balance by Exchange pages.